- The City’s finances are somewhat restrained in that the fees, taxes and revenues raised by a particular program are generally supposed to be reinvested in the corresponding program (eg sewer fees are earmarked to go back to funding sewer services and can’t be used for parks).
- The city’s funded debt load is constitutionally limited to 15% of Net Assessed Valuation of taxable real property.
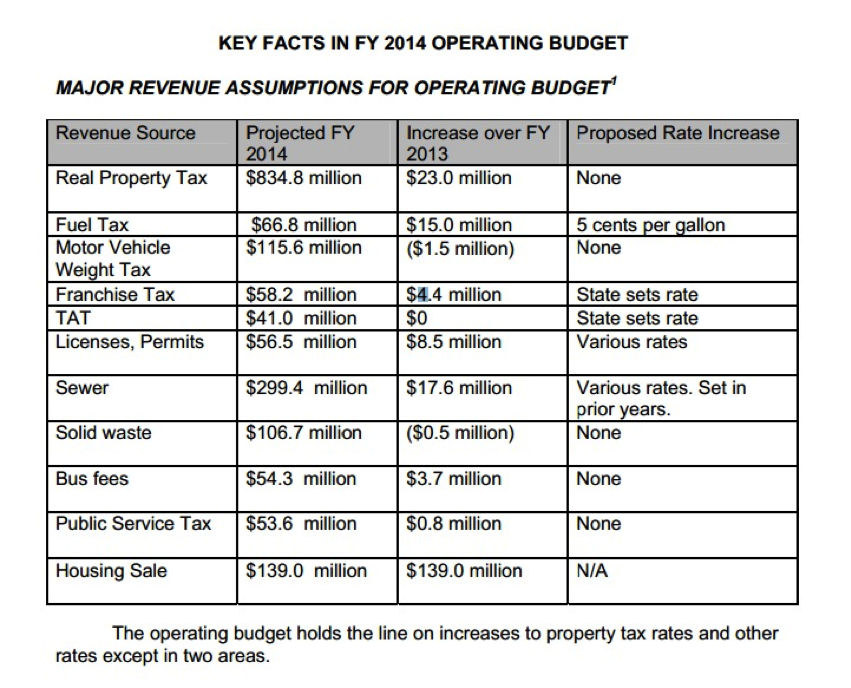
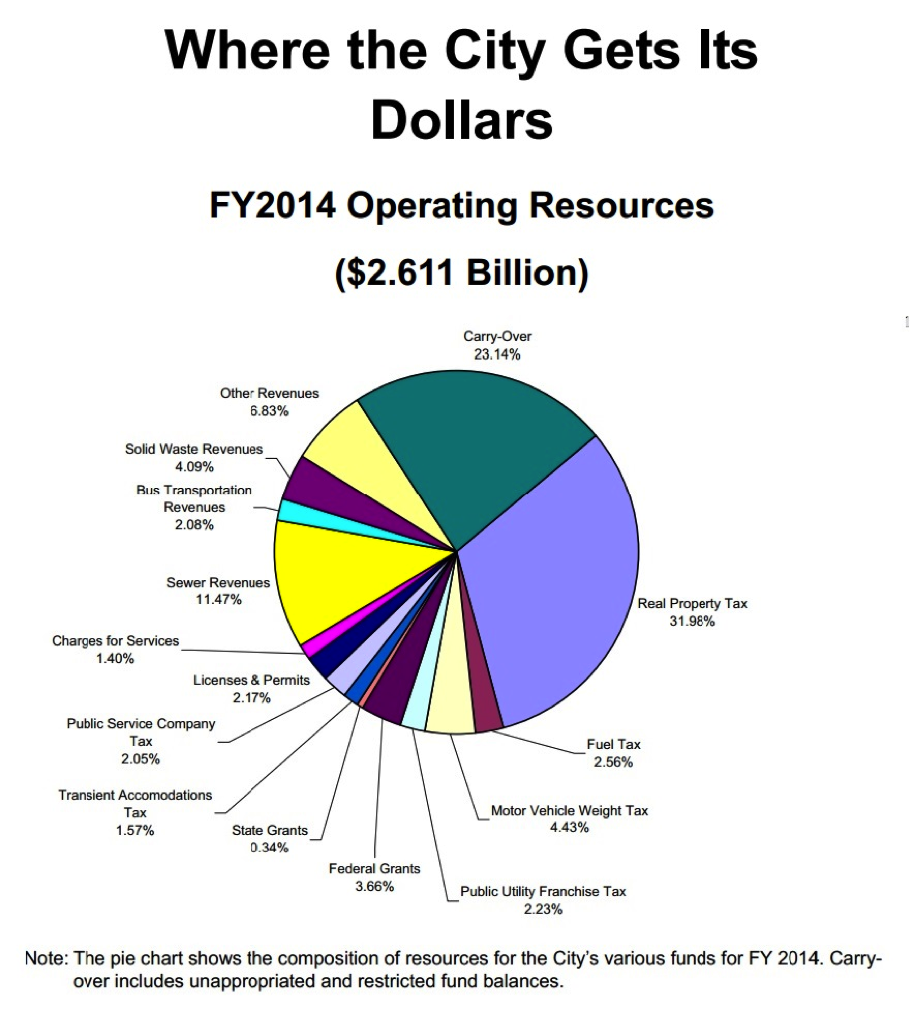
- Real Property Taxes is the largest source of income for the City, accounting for 32% or $832 mil of FY 2014 budget.
- Each year, the City adopts three budgets:
- The Executive Operating Budget explains how it gets and how it spends money in day to day operations of the executive branch (i.e. mayor’s office)
- The Legislative (i.e. the City Council) Budget explains how the City Council and its activities will be funded.
- The Capital Budget (AKA the CIP or Capital Improvement Program) lists and describes long term projects such highways, parks and buildings which the City will undertake within the next six years and years fund appropriations will be required.
- The Mayor’s office must submit its budget proposal to City Council before March 2nd each year, or 120 days before the start of the fiscal year, and City Council must pass the budget ordinance before June 15.
- The budget process includes many public hearings and meetings. It is restrained by the State Constitution, Statutes, City Charter and City Ordinances.
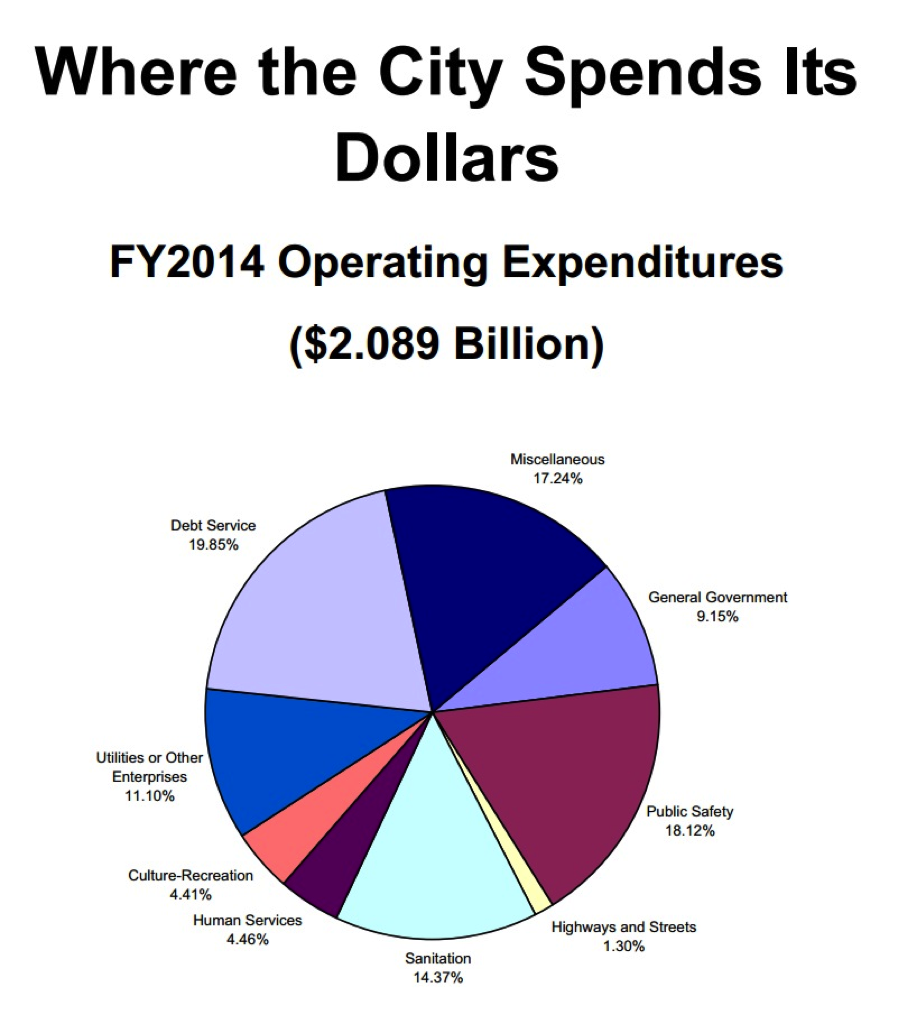
- Some 37 percent of the city’s $2.1 billion operating budget is tied to debt service and employee-related expenses such as Social Security and Medicare, health care and pension costs, what the city calls “nondiscretionary funding.” Public safety programs, including police, fire, ambulance and ocean safety services, make up 19.5 percent of the budget while sewer and trash operations take up about 13.9 percent of the budget.
- Transient Accommodation Tax (TAT)
- The TAT is 9.25% of transient accommodation gross proceeds received as compensation for the furnishing of public improvements and services. Two percent goes to the State of Hawaii and of the remaining 7.25%, the State distributes 44.8%, or up to $93 million (capped at $93 million up to FY 2015), to the counties, with the City receiving 44.1% of the Counties’ share.
Charts


